News
Bitcoin Weekly Analysis: Volume-Price Divergence and High-Level Consolidation Anticipated to Persist
Summary: Weekly Market Review Over the past week, the Bitcoin market experienced significant fluctuations. Opening at $119,086.65, the price saw a strong rally on Monday, once touching a weekly high of $123,218.00. However, the market failed to sustain its gains, quickly retreating on Tuesday to record a weekly low of $115,736.92. The week concluded with a ...
Weekly Market Review
Over the past week, the Bitcoin market experienced significant fluctuations. Opening at $119,086.65, the price saw a strong rally on Monday, once touching a weekly high of $123,218.00. However, the market failed to sustain its gains, quickly retreating on Tuesday to record a weekly low of $115,736.92. The week concluded with a closing price of $117,265.12, marking a weekly decline of 1.55% and a maximum amplitude of 6.28%. Weekly trading volume registered $15.628 billion. The candlestick chart formed a bearish candle with a long upper wick, yet it's noteworthy that the price remained above the 5-week moving average.
In my previous weekly review, I predicted that the price had broken above the previous high of $111,980, opening new upward potential. I anticipated further upward movement in the coming week, with attention to changes in trading volume. Bitcoin's overhead resistance was projected to be between $123,000 and $126,000, with support between $111,980 and $110,530. I assessed a low probability of a unilateral upward trend, with a higher likelihood of price oscillation within a new range ($116,000-$120,000).
Reviewing the actual market performance this week, my predictions were fully validated. On Monday, the market opened slightly higher and quickly surged, with a maximum increase of approximately 3.46%, refreshing the weekly high at $123,218. It then rapidly pulled back, closing the day as a small bullish candle with a long upper wick, showing a gain of about 0.62% and significantly increased volume.
On Tuesday, the price adjusted downwards, touching the weekly low of $115,736 before slowly recovering. The day closed as a bearish candle with a lower wick, marking a decline of approximately 1.76% and an amplitude of about 3.5%.
Over the subsequent trading days, the market consolidated, oscillating between the aforementioned high and low price points. This week's high precisely touched my predicted resistance zone, and the low also remained within the forecast range.
Undeniably, this week's market movement aligned closely with my expectations. Next, I will delve into analyzing the changes that occurred in the market over the past week using multi-cycle quantitative models and other dimensions.
Quantitative Model Analysis
1. Weekly Chart Analysis (Figure 1):
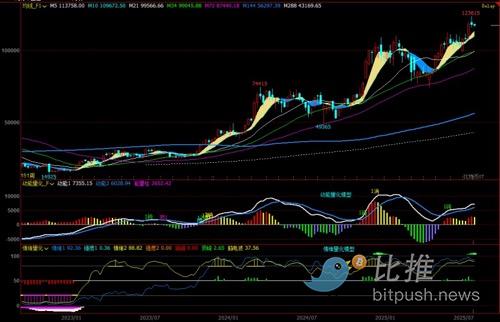
Momentum Quant Model: The Momentum Quant Model continues to exhibit a high-level dullness, strongly indicating a significantly increased possibility of forming a momentum top divergence in the coming weeks.
Sentiment Quant Model: Influenced by the initial volume-driven surge earlier in the week, the sentiment quantitative indicators have retreated slightly. However, Sentiment 1 strength remains at 1.01 (range 0-10), and Sentiment 2 is also approaching high levels, with the peak indicator recording 1.99. These data collectively suggest that market sentiment remains relatively high, warranting vigilance for potential sentiment reversal.
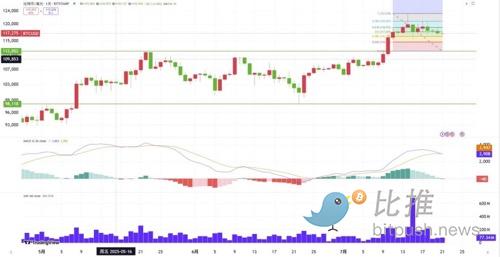
2. Daily Chart Analysis (Figure 2)
Momentum Quant Model: The daily level Momentum Quant Model also continuously signals high-level dullness. The Momentum 1 indicator line has shifted from upward to horizontal consolidation, and the energy bars show a gradual shortening trend, implying an increased probability of forming a momentum top divergence in the short term.
Sentiment Quant Model: The Sentiment Quant Model indicates that, due to the volume-driven surge and subsequent pullback earlier in the week, both sentiment indicators have begun to move away from high-level areas, suggesting a more cautious market sentiment.
Volume Analysis: Monday's significantly amplified trading volume, coupled with the long upper wick on the candlestick, clearly reveals substantial overhead selling pressure.
Next Week's Market Forecast
Given this week's characteristic of volume-driven stagnation, I assess that the vicinity of $123,218 has likely formed a recent high-level area.
Key Resistance Levels: My observation suggests that the first resistance level is around $121,200, while the range of $123,000 to $126,000 constitutes strong overhead resistance.
Core Support Levels:Initial support is near $115,700, with secondary support at $114,200. The range of $111,980 to $110,530 serves as a strong support zone, and I will closely monitor the buying interest within this area.
Oscillation Range Outlook:The market is expected to continue its up-and-down oscillation within the new established range.
Next Week's Trading Strategy (Excluding unforeseen news impacts)
Mid-term Position Strategy:Given that the market is still operating above the bull/bear channel, I advise mid-term investors to maintain prudent position sizing and hold existing positions.
Short-term Position Strategy:Following last week's strategy, short-term operations should strictly adhere to my predicted support and resistance levels, along with setting appropriate stop-loss points. I recommend a "sell high" strategy around $121,200 and a "buy low" strategy around $112,000.
The current hourly MACD indicator has formed a death cross above the zero axis, signaling a risk of short-term pullback. Combining this with key technical levels, my short-term strategy is as follows:
-
If the resistance level near $121,000 can be effectively breached, short-term investors may consider a bullish stance and look for entry opportunities.
-
If the price effectively breaks below the $116,500 support level, short-term action may indicate a further pullback to around $112,000. At that point, one might consider shorting accordingly or patiently waiting for new support signals before planning a rebound.
-
If the price continues to oscillate within the $116,000 to $121,000 range, I advise short-term investors to maintain a wait-and-see approach.
Real-time Dynamic Monitoring:I strongly recommend that investors closely follow my daily intra-day commentary articles to receive the latest trading views and market interpretations without delay.
Important Note:The above analysis and models represent the trading rules I follow in my operations. However, please be aware that this report does not constitute any investment advice or basis for buying/selling. All views are my personal opinions and are for reference only.
By: Cody Feng
Tags:
Link: Bitcoin Weekly Analysis: Volume-Price Divergence and High-Level Consolidation Anticipated to Persist [Copy]