News
BTC Weekly: Momentum Top Divergence Signals Potential Shift Lower
Summary: I. Weekly Market Overview Last week's market opened at $117,265.11. It reached a high of $120,247.80 on Tuesday and recorded its low of $114,723.16 on the same day. The week ultimately closed at $119,415.55, marking a 1.80% gain with a maximum amplitude of 4.71%. Trading volume for the week was $14.486 billion. The weekly candlestick ...
I. Weekly Market Overview
Last week's market opened at $117,265.11. It reached a high of $120,247.80 on Tuesday and recorded its low of $114,723.16 on the same day. The week ultimately closed at $119,415.55, marking a 1.80% gain with a maximum amplitude of 4.71%. Trading volume for the week was $14.486 billion. The weekly candlestick formed a small bullish candle, with the price closing above the 5-week moving average.
Bitcoin Weekly Chart: (Momentum & Sentiment Quantitative Models)

[ Figure 1]
Bitcoin Daily Chart:
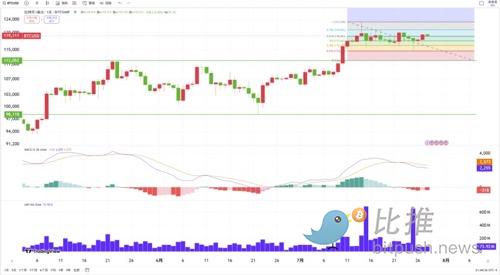
[Figure 2]
Hourly Chart:

[Figure 3]
In my previous weekly review, I predicted that given the characteristics of volume-driven stagnation, there was a high probability that the vicinity of $123,218 would form a recent high-level area, and the market would exhibit upward and downward oscillations within a new range. Bitcoin's first overhead resistance was forecasted around $121,200, with strong resistance between $123,000 and $126,000. Below, the first support was around $115,700, the second around $114,200, and strong support was anticipated between $111,980 and $110,530.
Reviewing this week's actual performance, the market oscillated after Monday's open, closing with a small bullish candle with a long upper wick. On Tuesday, it adjusted downwards, finding support near $116,128 (close to the predicted first support of $115,700) before quickly rallying to hit the week's high of $120,247, closing as a bullish candle. The following two days saw further oscillations, resulting in two consecutive bearish candles.
On Friday, the price declined again, touching the week's low of $114,723 (close to the predicted second support of $114,200) before bouncing back, closing as a bearish candle with a long lower wick. The rest of the weekend's trading remained within these high and low points.
This week's two instances of price adjustment and subsequent resistance encountered were very close to the predicted levels from last week. It is fair to say that this week's actual market movements were highly consistent with last week's predictions: going short at resistance levels and long at support levels. Next, I will analyze the market's changes from various multi-cycle quantitative model perspectives.
II. Multi-Cycle Quantitative Model Analysis: Alert for Top Signals
1. Weekly Chart Analysis (Figure 1): High-Level Dullness, Precursor to Divergence
-
Momentum Quantitative Model: The momentum indicator at the weekly level continues to signal "high-level dullness" (a precursor to forming divergence). This indicates a very high probability of a momentum top divergence forming in the coming weeks.
-
Sentiment Quantitative Model: Sentiment 1 indicator strength is 1.93 (on a scale of 0-10), Sentiment 2 indicator is approaching high levels, and the peak indicator recorded 2.90. These data suggest that the weekly level remains at an elevated state.
2. Daily Chart Analysis (Figure 2): Momentum Top Divergence Confirmed, Adjustment Likely
-
Momentum Quantitative Model: This Wednesday, the Momentum 1 indicator line at the daily level formed a death cross below the Momentum 2 indicator line, confirming the formation of a daily-level momentum top divergence. The gap between the two lines is gradually widening, and the Momentum 1 indicator line has begun moving downwards.
-
Sentiment Quantitative Model: Both sentiment indicators have started to fall from high levels and are slowly declining. These data indicate that a slow adjustment at the daily level has begun.
3. Hourly Chart Analysis (Figure 3): Range-Bound Oscillation, Short-Term Weakness
-
The hourly chart continues to follow the previously expected range-bound oscillation.
-
Currently, the MACD indicator has formed a death cross above the zero axis, and with sentiment indicators showing a top, the next two days (early next week) are likely to see downward oscillation.
-
Focus on the $116,000 and $114,800 price levels. These serve as the first and second resistance levels. If strong support is found here, a bounce upward could continue.
III. Next Week's Market Forecast: Shifting from Oscillation to Downward Adjustment
Based on the multi-cycle quantitative model analysis, I forecast the following for the coming week:
-
Trend Outlook: With the daily-level momentum top divergence confirmed, the market trend will gradually shift from high-level oscillation to a downward adjustment. The intensity of this adjustment remains to be observed.
-
Resistance Levels:
-
First resistance level is around $120,250.
-
Second resistance level is around $121,200.
-
Strong resistance is between $123,000 and $126,000.
-
Support Levels:
-
First support level is around $114,200.
-
Strong support is between $111,980 and $110,530. I will particularly focus on the strength of support in this area.
IV. Next Week's Trading Strategy: Defensive Posture, High-Sell/Low-Buy
(Excluding impacts from unexpected news)
-
Overall Approach: Following the confirmed daily-level momentum top divergence, my trading strategy will shift from an "aggressive long" mindset to a "defensive" one. This implies that Bitcoin is highly likely to be in a consolidating or downward trend at this level.
-
Mid-Term Positions: As momentum top divergence has formed, investors are advised to consider selling approximately 25% of their mid-term positions if the price experiences an upward surge next week, to lock in some profits. The remaining mid-term positions can be held, but closely monitor the bull/bear channel for any breaches.
-
Short-Term Positions: Short-term operations should strictly adhere to the predicted support and resistance levels, setting appropriate stop-loss points. A "high-sell, low-buy" strategy is recommended:
-
Shorting: Consider shorting when encountering overhead resistance (e.g., $119,000, $120,800).
-
Longing: Consider longing when encountering support levels (e.g., $116,000, $114,200).
Important Note:The models mentioned above are trading rules I personally adhere to and do not constitute any basis for buying or selling. These are personal views and are for reference only.
Tags: BTC
Link: BTC Weekly: Momentum Top Divergence Signals Potential Shift Lower [Copy]