News
BTC Weekly Outlook: A Bullish Week, but Signs Point to a Shift to Defensive Play
Summary: Weekly Market Recap: (August 4 - August 10) This past week, Bitcoin opened at $114,208.81. The price dropped to a low of $112,650.00 on Tuesday before rallying to a high of $119,311.11 on Friday. The week closed at $119,294.01, marking a weekly gain of 4.26% and a maximum fluctuation of 5.83%. Trading volume for the ...
Weekly Market Recap: (August 4 - August 10)
This past week, Bitcoin opened at $114,208.81. The price dropped to a low of $112,650.00 on Tuesday before rallying to a high of $119,311.11 on Friday. The week closed at $119,294.01, marking a weekly gain of 4.26% and a maximum fluctuation of 5.83%. Trading volume for the week reached $9.143 billion. A strong bullish candle was formed, with the price closing below the 5-week moving average.
Bitcoin Weekly K-Line Chart (Momentum & Sentiment Models):
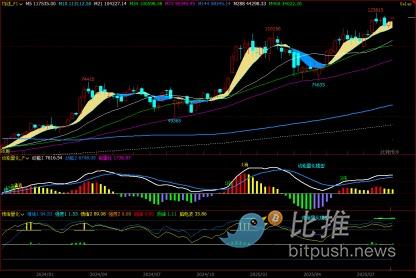
Figure 1
Bitcoin Hourly K-Line Chart:
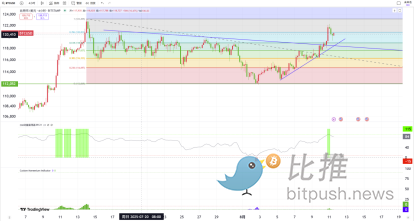
Figure 2
In my previous weekly review, I predicted that $123,218 had become the recent high for the index. A pullback to the strong support zone of $111,980 to $110,530 was expected to trigger a rebound. I also anticipated that after the rebound, the price would retest this support zone, with a low probability of a significant breakdown this week. The index was then expected to rebound again, with the first resistance level around $116,800and the second around $120,250.
My previous trading strategy was to shift from an aggressive long position to a defensive one after a daily momentum top divergence was confirmed. When the index formed a daily momentum top divergence and broke below the lifeline channel, I issued two separate reminders for investors to sell off their long positions, reducing their short-term holdings to about 30% of their original size, and to wait on the sidelines while monitoring the outcome of the bullish and bearish channels.
This week's actual price action aligned with my previous predictions. The index opened around $114,208 on Monday and saw a gradual increase, closing with a 0.73% gain. On Tuesday, the index opened with a rapid drop, retesting the support near $111,980. After hitting the weekly low of $112,650, the index found support and began to rebound, closing with a small bearish candle with a long lower wick. Wednesday saw a small bullish candle, followed by a strong rally on Thursday with a 2.11% gain. The next two days saw small corrections, and on Sunday, the price rebounded again, closing with a 2.37% gain.
Now, I will analyze the internal structure of the index's movements from a multi-cycle technical perspective.
1. Weekly Chart Analysis (Figure 1):
Momentum Model: The model continues to show a high-level consolidation signal, which is a precursor to a top divergence. The momentum line remains flat, and the volume (red) bar has shortened compared to last week, indicating that despite the rebound, buying momentum is insufficient.
Sentiment Model: Both sentiment indicators have dropped from the high zone, with a peak value of **0.75**.
Digital Monitoring Model: No digital signals are currently displayed.
2. Hourly Chart Analysis (Figure 2):
Momentum Model: After the momentum top divergence formed, the momentum line slowed as it approached the zero axis. The volume (green) bars gradually shortened, suggesting that the index found support and began to rebound.
Sentiment Model: Both sentiment indicators reached the high zone today, and BTC has since begun to correct downwards.
Volume: Daily trading volume has been stable, with no significant spikes.
Next Week's Market Forecast: (August 11 - August 17)
1. Next week, BTC's price is expected to continue its upward momentum, but with a high probability of entering a range-bound consolidation.
2. Resistance Levels: The first resistance is around $120,800 (already breached), with the strong resistance level at $123,218.
3. Support Levels: The first support is around $118,800, with strong support at $114,200.
Next Week's Trading Strategy (Excluding sudden news events): (August 11 - August 17)
1. Mid-term Positions: Mid-term positions should be held, and I will maintain a wait-and-see approach until the mid-term direction of the index becomes clearer.
2. Short-term Positions: After the price breaks above the downtrend line, the strategy will shift to buying the dips. It is important to watch the support levels closely. Short-term positions can be initiated upon the formation of an hourly bottom fractal. If the price breaks below the uptrend line ($118,400-$118,800), the strategy will be re-evaluated.
The models and trading rules mentioned here are for my personal use and do not constitute any basis for buying or selling. This is my personal opinion and is for reference only.
Author: Cody Feng
Tags:
Link: BTC Weekly Outlook: A Bullish Week, but Signs Point to a Shift to Defensive Play [Copy]