News
S&P 500 Enters Key Turning Point Window; A Cautious "Wait-and-See" Approach is Advised
Summary: I. Weekly Market Review (August 11 - August 15) The S&P 500 opened the week on Monday at 6389.67, marking the week's low of 6364.06 shortly after. The index subsequently rallied to a new high of 6481.34 on Friday before closing the week at 6449.80. The total weekly range was 117.28 points, resulting in a ...
I. Weekly Market Review (August 11 - August 15)
The S&P 500 opened the week on Monday at 6389.67, marking the week's low of 6364.06 shortly after. The index subsequently rallied to a new high of 6481.34 on Friday before closing the week at 6449.80. The total weekly range was 117.28 points, resulting in a **gain of 0.94%**. The weekly chart formed a bullish candlestick, closing above the 5-week moving average.
S&P 500 Weekly Chart (Momentum & Sentiment Quantitative Models)
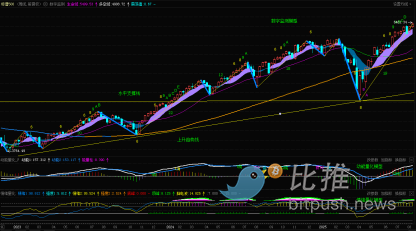
(Figure 1)
S&P 500 Daily Chart
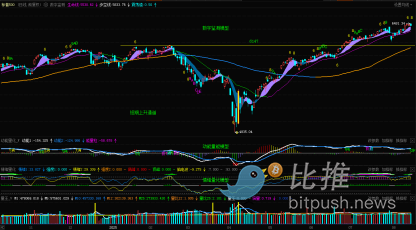
(Figure 2)
S&P 500 Weekly Chart (Historical Backtesting)
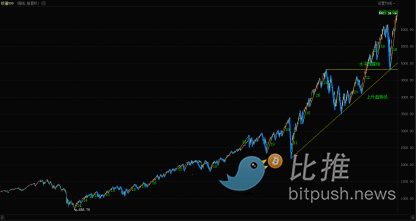
(Figure 3 )
Since the rally began on April 7, the index has now risen for 19 consecutive weeks, spanning 91 trading days, with a cumulative maximum gain of 34.05%.
In last week's analysis, we forecasted this week's price action based on multi-dimensional technical analysis and historical backtesting. We anticipated that the index would set a new high but face significant resistance near the 6427 level with limited further upside. We also highlighted the ascending channel formed since May 2 and noted the critical "turning point" window around August 14, emphasizing a higher probability of a downward move if the window proved effective.
This week's market action aligned closely with our forecast. After a narrow consolidation on Monday, the index broke through the 6427 resistance level on Tuesday. It then consolidated above this level for two days before hitting the week's high on Friday and reversing slightly. Having rallied for 19 consecutive weeks, the index has now officially entered this critical turning point window.
Below, we continue our multi-dimensional technical analysis of the index's current state.
(A) Quantitative Model Signal Analysis:
1. Weekly Perspective (Figure 1):
Momentum Quantitative Model: The model continues to show a high-level "passivation" signal. While the primary momentum line is rising, the energy histogram (red bars) has shortened compared to last week, suggesting that bullish momentum is waning despite the price increase.
Sentiment Quantitative Model: Indicators remain at elevated levels. Sentiment 1 Strength is approximately 4.51 (on a scale of 0-10), and Sentiment 2 Strength is around 3.51.
Digital Monitoring Model:The weekly "D" turning point signal issued on July 25 has been invalidated. No new signal was generated this week.
Peak Signal: The value has reached 6.54, indicating an accumulation of risk.
2. Daily Perspective (Figure 2):
Momentum Quantitative Model: After a bullish "golden cross" on Wednesday, the model's bearish divergence has entered a passivation state. The energy histogram (red bars) shortened on Friday compared to Thursday.
Sentiment Quantitative Model: As of Friday's close, the Sentiment 1 indicator is 5.16 and the Sentiment 2 indicator is 0.38, with both re-entering the high-risk zone.
Digital Monitoring Model: The daily top signal ("9") issued on July 29 was set to be invalidated by a close above 6389.77. Tuesday's close at 6445.76 has officially invalidated this previous top signal.
Volume:Trading volume showed no significant increase throughout the week.
(B) Trend Timing & Historical Backtesting Analysis (Figure 3):
Backtesting Period: March 6, 2009, to April 4, 2025 (840 weekly bars).
Correction Criteria:A pullback of ≤2 weeks with a decline of ≥5%, or any pullback lasting ≥3 weeks. This identified 52 qualifying corrections.
Historical Pattern:Statistical analysis reveals that after the index rallies for 19 consecutive weeks, the probability of a subsequent correction is approximately 88.5%, with a high likelihood of that correction being substantial.
Current Situation:From April 7 to August 15, the index has completed a 19-week rally, significantly increasing the probability of an impending adjustment based on historical precedent.
II. Market Forecast (August 18 - August 22)
1. We believe the index may attempt to push higher next week, but upside potential appears very limited. In the event of a downward correction, the initial support level is located at the 6300-6340 zone, with a more critical support area between 6200-6147.
2. The index continues to operate within the ascending channel that began on May 2. The upper and lower bounds of this channel should be monitored as key resistance and support. A break of the lower trendline will be a critical bearish signal.
3. Having entered the turning point window on August 14, next week's directional move is crucial. If this time window proves effective, we believe a downward break is the more probable outcome.
4. Investors should pay close attention to market-moving news and any unusual activity in large-cap, high-weighting stocks.
III. Trading Strategy (August 18 - August 22)
1. Expect a continued oscillating structure next week with limited upside. A confirmed break below the 6200-6147 support zone would signal a potential market top and a significant downside risk.
2. Medium-Term Positions:Although the index has closed above its critical "lifeline" moving average for three consecutive days, the looming turning point window calls for caution.
For conservative investors: We recommend maintaining the current 30% medium-term allocation and waiting for a clear directional break before making adjustments.
For aggressive investors: Positions can be increased as long as the index remains above the lifeline, but should be reduced immediately if it breaks below.
Our firm recommendation leans towards the first, more conservative approach.
3. Short-Term Trading: Employ strict stop-loss orders. Traders can play the range by selling into strength near the upper channel boundary and buying on dips near the lower boundary and key support levels.
4. For more precise entries and exits, traders can switch to smaller timeframes, such as the 60-minute or 120-minute charts.
*Disclaimer: The models and analysis provided are based on the author's personal trading rules and do not constitute investment advice. This article represents a personal viewpoint for reference only.*
Author: Cody Feng
Tags:
Link: S&P 500 Enters Key Turning Point Window; A Cautious "Wait-and-See" Approach is Advised [Copy]