News
Bitcoin Weekly Analysis: Is a Bear Market on the Horizon?
Summary: I. Weekly Market Review: August 18 - 24 This past week, Bitcoin opened at $117,465, hitting a high of $117,622 on Monday and a low of $110,671 on Sunday. It ultimately closed at $113,478, marking a 3.41% weekly decline. The maximum price fluctuation was 6.28%, with a total trading volume of $13.5 billion. The weekly ...
I. Weekly Market Review: August 18 - 24
This past week, Bitcoin opened at $117,465, hitting a high of $117,622 on Monday and a low of $110,671 on Sunday. It ultimately closed at $113,478, marking a 3.41% weekly decline. The maximum price fluctuation was 6.28%, with a total trading volume of $13.5 billion. The weekly chart closed with a large bearish candle, pushing the price below the 5-week moving average.
In my previous weekly review, I predicted a primary trend of a downward correction, with potential for technical rebounds at support levels. I identified the first key support at $114,200 and a stronger support zone between $111,980 and $110,530. The market's price action this past week validated these predictions. The price repeatedly found support in the exact zones I identified, and my short-term trading strategy, including entry and exit points, proved to be entirely profitable.
II. Quantitative Model Signal Analysis
I will now analyze the current market's internal structure using a multi-period technical analysis of our quantitative models.
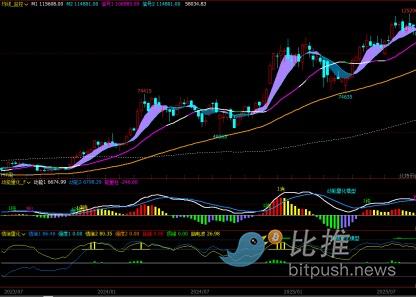
1. Weekly Perspective
-
Momentum Quantitative Model: It continues to flash a high-level divergence signal. Momentum line 1 is moving downward, approaching momentum line 2, and the energy (red) column has shortened compared to last week. The model indicates a high risk of price decline.
-
Sentiment Quantitative Model: Both sentiment indicators are at 0, with a peak value of 0.67. The model suggests a moderately high risk of price decline.
-
Digital Monitoring Model: No signals have been triggered this week.
Conclusion: The weekly data suggests the price is in the midst of a correction, with attention now focused on when a bearish momentum divergence will form.
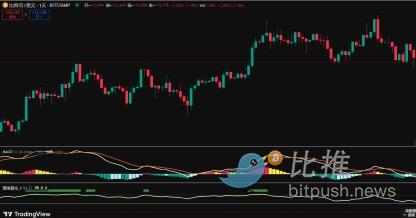
2. Daily Perspective
-
Momentum Quantitative Model: A daily momentum top divergence was confirmed on Monday. Following Friday's close, momentum line 1 has crossed below the zero axis, and momentum line 2 is about to follow, indicating the market is on the verge of entering a bearish trend. The model's price decline index is high.
-
Sentiment Quantitative Model: On Friday, both sentiment indicators fell out of the high-level zone.
-
Volume: Daily trading volume has not shown any significant changes.
Conclusion: The data from all models indicates that a daily momentum top divergence has formed, and the price is about to enter a bearish market.
III. Next Week's Outlook & Strategy: August 25 - 31
-
Keep a close eye on the $114,700 level. If the price breaks above it, its upside potential is limited, and it will likely fall back down after encountering resistance. If it effectively breaks below, the price will continue its downward correction.
-
Resistance Levels: The first resistance is around $114,700, the second is near $117,400, and the strong resistance is in the $119,000 area.
-
Support Levels: The first support is between $111,980 and $110,530. If this support holds, the price will remain in a weak consolidation. If it breaks, the downward trend will accelerate. The second support is near $105,300, with strong support in the $98,000 area.
IV. Trading Strategy
-
Mid-term Positions: I recommend maintaining a mid-term position of around 30%. However, if the price effectively falls below the bull-bear channel, all mid-term long positions should be sold off, and you should hold cash until the mid-term direction becomes clear again.
-
Short-term Positions: I recommend a primary strategy of shorting on rallies with a set stop-loss. This strategy should be executed on an hourly chart to get the most precise entry and exit points.
-
Entry 1: Initiate a short position near the opening price with a stop-loss at $114,900.
-
Entry 2: Near $110,530, if a bottoming signal appears, sell off half of the short position and set a take-profit at $112,500.
-
Entry 3: If the price effectively breaks below $110,530, it's advisable to re-enter a short position near this point, with a take-profit set at $111,500.
-
Entry 4: If the above trades are successful and the price falls to the $105,300 area, clear all remaining short positions upon seeing a bottoming signal.
The above models are the trading rules I abide by. This content does not constitute investment advice and is for personal reference only.
Author: Cody Feng