News
BTC Weekly Outlook: The Oversold Bounce—A Bottom or a Shorting Opportunity?
Summary: Weekly Market Recap: (August 25 - August 31) This week began with an opening price of $113,491. Bitcoin hit its weekly high on Monday at $113,645 and its low on Sunday at $107,389, ultimately closing the week at $108,269 This resulted in a weekly decline of 4.59%, a maximum volatility of 5.83%, and a trading ...
Weekly Market Recap: (August 25 - August 31)
This week began with an opening price of $113,491. Bitcoin hit its weekly high on Monday at $113,645 and its low on Sunday at $107,389, ultimately closing the week at $108,269 This resulted in a weekly decline of 4.59%, a maximum volatility of 5.83%, and a trading volume of $12.252 billion. The price formed a large bearish candle, closing below the 10-week moving average.
Review of Last Week's Forecast:
In my previous weekly review, I predicted that Bitcoin was about to enter a bearish market, with the week's trend being primarily a volatile decline. I identified key resistance levels and support levels:
Upward Resistance: First at $114,700, and a second at $117,400.
Downward Support:First at $111,980 to $110,530, where a technical rebound was expected before further decline. A break below this level was expected to accelerate the drop. The second support was at $105,300, with strong support at $98,000.
My operating strategy for the week was:
1. Mid-term: Hold around 30% of mid-term long positions. If the price broke the bull-bear channel, all long positions were to be sold, with a "wait-and-see" approach.
2. Short-term: Focus on shorting on rallies with a set stop-loss (using a 1-hour timeframe).
Shorting near the opening price with a stop-loss at $114,900.
Partially taking profits on shorts around $110,530.
Re-entering short positions if the price broke below $110,530.
Closing all short positions near $105,300 if a bottom signal appeared.
Actual Market Performance Review
The market's actual movements closely followed my predictions. On Monday, after opening at $113,491 and a small bounce, the price began a volatile descent. It found temporary support near $109,283, very close to my predicted first support level of $110,530.
After a three-day rebound, the price experienced a second major drop on Friday, which was more powerful than the first, completely "engulfing" the gains from the previous three days. The price eventually stabilized at its weekly low of $107,389, a level very close to my second predicted support at $105,300.
My short-term trading strategies from last week were all successfully executed for a profit. The market's movements and key price points provided validation for my prior analysis and strategies.
Next Week's Outlook (September 1 - September 7)
Based on a multi-dimensional technical analysis, the internal structure of Bitcoin has undergone significant changes this week.
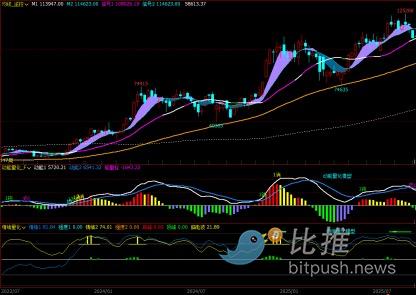
1. Weekly Chart Analysis:
Momentum Quantification Model:This week's close saw the momentum 1 and 2 lines form a death cross, confirming a weekly momentum top divergence. The momentum histogram has turned from positive to negative.
Model Signal: High probability of further price decline.
Sentiment Quantification Model:Both sentiment indicators are at a strength of 0, with a peak value of 0.
Model Signal:The price is in a clear downtrend.
Digital Monitoring Model:No digital signals are currently displayed.
Overall:The weekly chart suggests the market is in the early stages of a downturn.
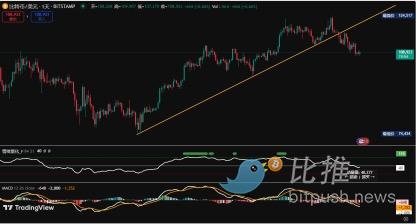
2. Daily Chart Analysis:
Momentum Quantification Model:Following the daily momentum top divergence, both momentum lines have now crossed below the zero axis.
Model Signal:High probability of further price decline.
Sentiment Quantification Model:As of Sunday's close, both sentiment indicators are below 50.
Volume:Over the past seven trading days, volume has contracted during rallies and expanded during drops, which is a textbook bearish signal.
Overall: The daily chart has entered a full-fledged bear market.
3. Next Week's Forecast:
1. Both the weekly and daily charts have confirmed momentum top divergences, indicating the market has entered bearish territory. Investors should shift their trading mindset from "bullish mode" to "bearish mode."
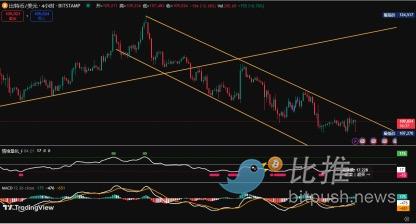
2. After the recent significant drop, multiple hourly charts show oversold conditions, suggesting a short-term technical rebound is needed.
3. I believe a small turning point will occur around September 3rd, potentially leading to a technical rebound lasting approximately seven days.
4. Resistance Levels:
First Resistance: near $110,530
Second Resistance: in the $112,000-$113,500 range
Strong Resistance: near $115,000
5. Support Levels:
First Support: near $105,300
Strong Support: in the $98,000-$100,500 range. A strong rebound is highly probable if the price falls to this strong support area.
Next Week's Trading Strategy (Excluding Unexpected News):
1. Mid-term Positions:All mid-term long positions have been sold this week after the price broke the key trend channel. I will now observe the market and use the upcoming technical rebound to gradually build mid-term short positions
2. Short-term Positions:Set a stop-loss and focus on shorting on rallies (using a 1-hour timeframe).
Scenario 1: Price Finds Short-Term Support Near $107,000
Wait for the technical rebound. If a top signal appears in the $112,000-$113,500 range, open a small short position.
If the rally continues, add a small amount to the short position in the $114,000-$115,000 range. Both entries should have a stop-loss set just above $115,000.
If the price drops to the $105,300-$107,000 range and shows a bottom signal, sell half of the short position.
If the price effectively breaks below the $105,300-$107,000 range, the profit-taking target for the remaining shorts moves down to $107,000.
If the above operations are successful, sell all remaining short positions when the price reaches near $100,000.
Scenario 2: Price Effectively Breaks Below $107,000 Immediately
Open short positions in the $107,000-$105,300 range.
Set a stop-loss at $108,500.
Sell all short positions when the price drops to $100,000, and then wait for a rebound.
The models and strategies presented are based on my personal trading rules and do not constitute any buying or selling advice. This is for reference only.
Author: Cody Feng
Tags:
Link: BTC Weekly Outlook: The Oversold Bounce—A Bottom or a Shorting Opportunity? [Copy]