News
BTC Weekly Watch: Is the Rebound "Feast" Nearing Its End?
Summary: 1. A Look Back at the Week’s Market (Sep 08 - Sep 14) This week started with an opening price of $111,144. Bitcoin hit a low of $110,624 on Monday and a high of $116,805 on Friday, eventually closing at $115,342. This represents a weekly gain of 3.78%, with a maximum fluctuation of 5.59% and ...
1. A Look Back at the Week’s Market (Sep 08 - Sep 14)
This week started with an opening price of $111,144. Bitcoin hit a low of $110,624 on Monday and a high of $116,805 on Friday, eventually closing at $115,342. This represents a weekly gain of 3.78%, with a maximum fluctuation of 5.59% and a trading volume of $10.064 billion. The weekly candle was a positive one, but the price closed below the 10-week moving average.
In my previous weekly review, I predicted:
1. Bitcoin had entered a bearish market on both the weekly and daily charts, and the subsequent trend would be to short on rallies.
2. The following week would see a 3 to 6-day rebound period before resuming a volatile downtrend.
3. Resistance levels: The first resistance was around $113,500, with strong resistance near $115,000.
4. Support levels: The first support was around $105,300, with strong support in the $98,000 to $100,500 range.
My previous strategy was:
1. Mid-term positions: I had already established a 30% short position and planned to gradually increase it.
2. Short-term positions: I advised setting stop-loss points and primarily shorting on rallies (using a 1-hour timeframe).
* Hold short positions opened in the $112,000 to $113,500 range. When the price rebounded to the $114,000 to $115,000 range, add to the short position. Set stop-loss for both entries above $115,000.
* If the price dropped to the $105,300 to $107,000 range, sell half of the short position with a take-profit target lowered to $110,000.
* If the price broke below the $105,300 to $107,000 range, lower the take-profit target to $107,000.
* If the price dropped to around $100,000, sell all short-term positions.
Review of the Actual Weekly Trend:
On Monday, Bitcoin opened at $111,144 and pulled back to a weekly low of $110,624 before starting a volatile rebound, closing with a 0.86% gain. On Tuesday, the price fluctuated around $112,000, closing as a small bearish candle with a 0.51% loss.
From Wednesday to Friday, the price rebounded for three consecutive days, with the bullish momentum gradually decreasing. The daily gains were 2.20%, 1.36%, and 0.50% respectively. The three-day price swing was 5,873 points, and the weekly high of $116,805 was reached on Friday. Over the weekend, the price saw a slight correction, closing with small bearish candles of 0.11% and 0.55% loss.
The actual trend showed a five-day rebound this week, bringing the total rebound since September 1st to 12 days. This confirms my previous forecast of a 10 to 13-day rebound period. As the market is still in a rebound phase and no clear top signal has appeared on the daily chart, I continue to hold my small short-term positions and am waiting for further developments to make other moves.
Now, I will analyze the changes in Bitcoin's internal structure using multi-dimensional technical indicators.

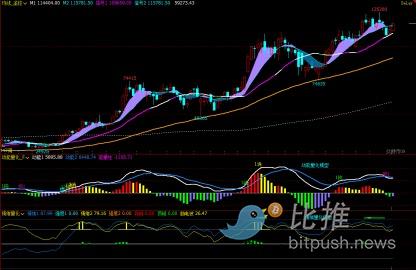
1. Weekly Chart Analysis (Figure 1):
Kinetic Energy Model: The weekly chart is in a kinetic energy top divergence process. After two consecutive weeks of technical rebounds, the volume (green) column has shortened compared to last week.
Model forecast: High probability of a price decline.
Sentiment Model: Both sentiment indicators are at a strength of 0, with a peak value of 0.
Model forecast:The price is in a downtrend.
Digital Monitoring Model: No digital signals are currently displayed.
Conclusion: The weekly chart indicates the early stages of a decline.
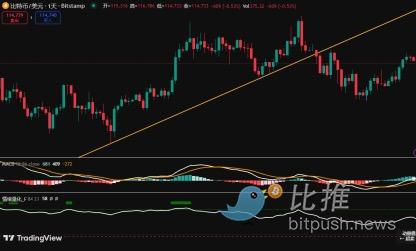
2. Daily Chart Analysis (Figure 2):
Kinetic Energy Model: After 12 consecutive days of rebound, the kinetic energy line 1 is back near the zero axis, while line 2 is still below the zero axis. After nine consecutive days of gradual growth, the energy (red) column shortened for the first time on Sunday.
Sentiment Model: Both sentiment indicators were below 50 after Sunday's close.
Conclusion: The daily chart's technical rebound is entering a strong resistance zone. We need to observe the changes in the direction of the two kinetic energy lines.
2. Forecast for Next Week's Market (Sep 15 - Sep 21)
1. Bitcoin remains in a bearish market on both the weekly and daily charts. The main strategy is to short on rallies.
2. Next week, Bitcoin may see a small rebound, possibly even a new high for this technical rebound. However, I believe we are in the final stages of this rally, with little time or room left. After this rebound ends, the price will likely continue its volatile downtrend.
3. Resistance levels: First resistance is around $117,800, with strong resistance near $119,300.
4. Support levels: First support is around $113,500. The second support is in the $105,300 to $107,000 range. S
trong support is in the $98,000 to $100,500 range.
3. Trading Strategy for Next Week (Sep 15 - Sep 21)
1. The September Federal Reserve meeting is coming up next week, and the interest rate decision will be announced. I advise investors to pause trading and observe the market before the news is released.
2. Mid-term positions: I've already established a 30% short position. For my next steps, please follow the link at the bottom of the original article.
3. Short-term positions: Set a stop-loss and primarily short on rallies (using a 1-hour timeframe).
Continue to hold the small short position opened near $113,500. This position has already entered the stop-loss zone and may be closed at any time next week.
Focus on observation in the first half of the week. Make decisions in the second half of the week after the market digests the news.
The models mentioned are the trading rules I follow personally and do not constitute any basis for buying or selling. This is my personal opinion and is for reference only.
Author: Cody Feng